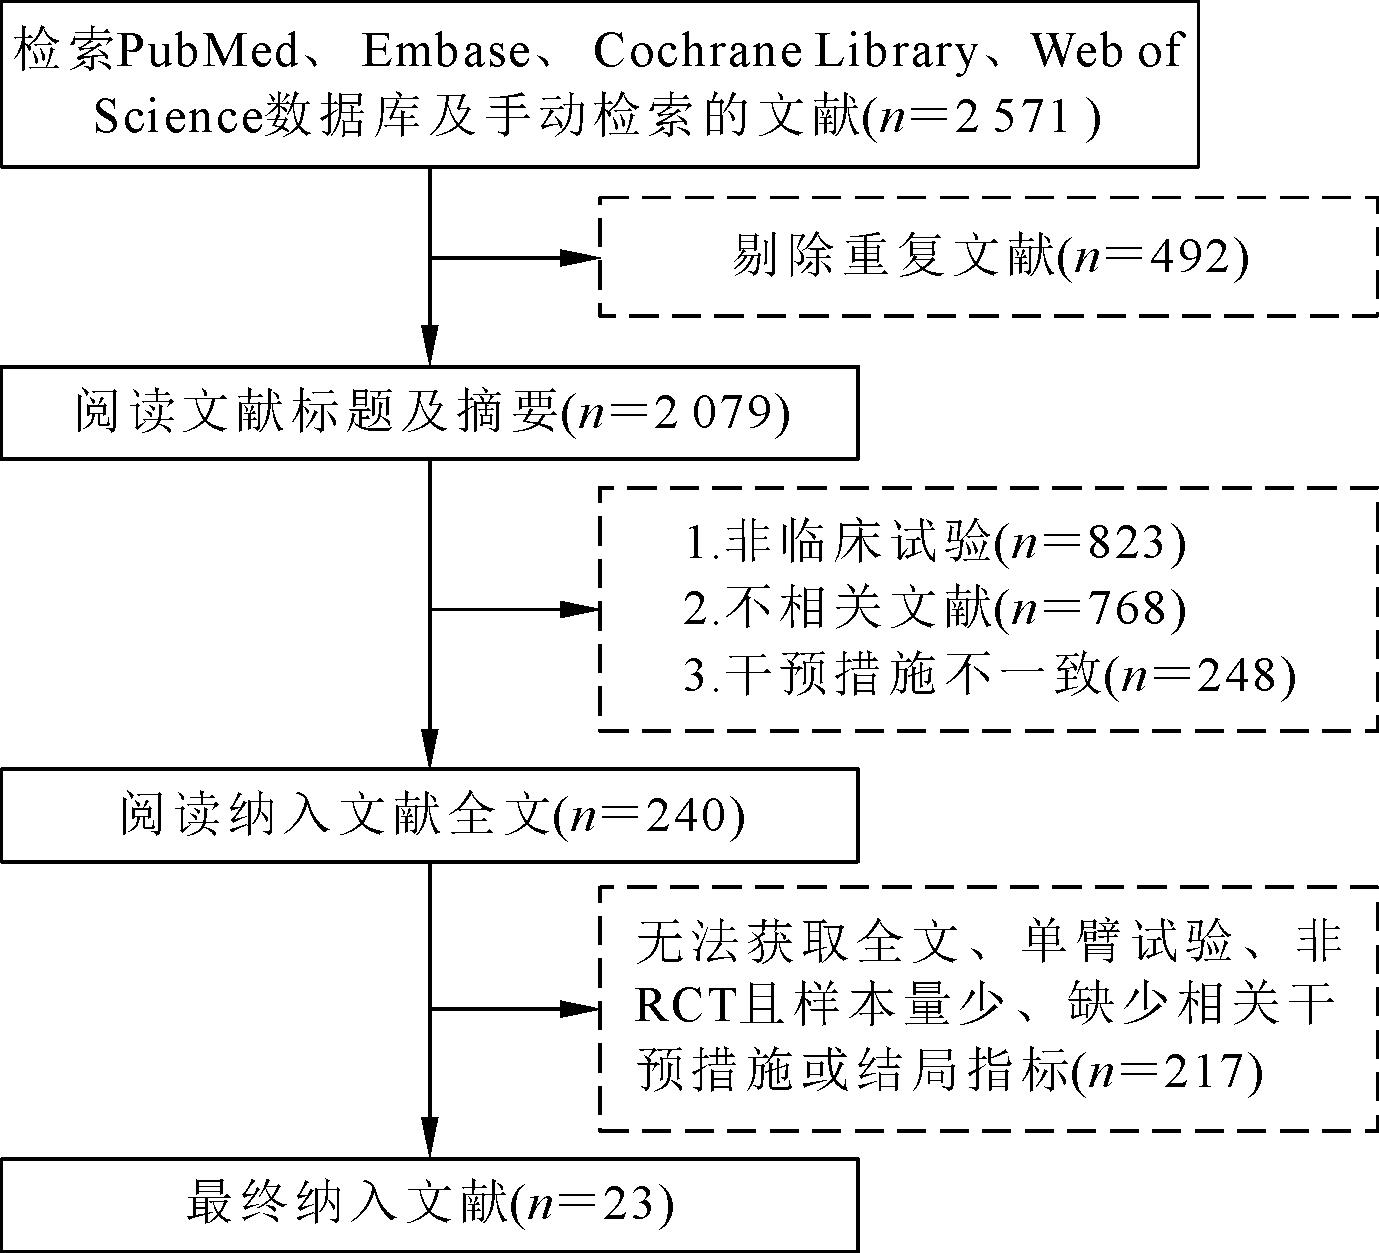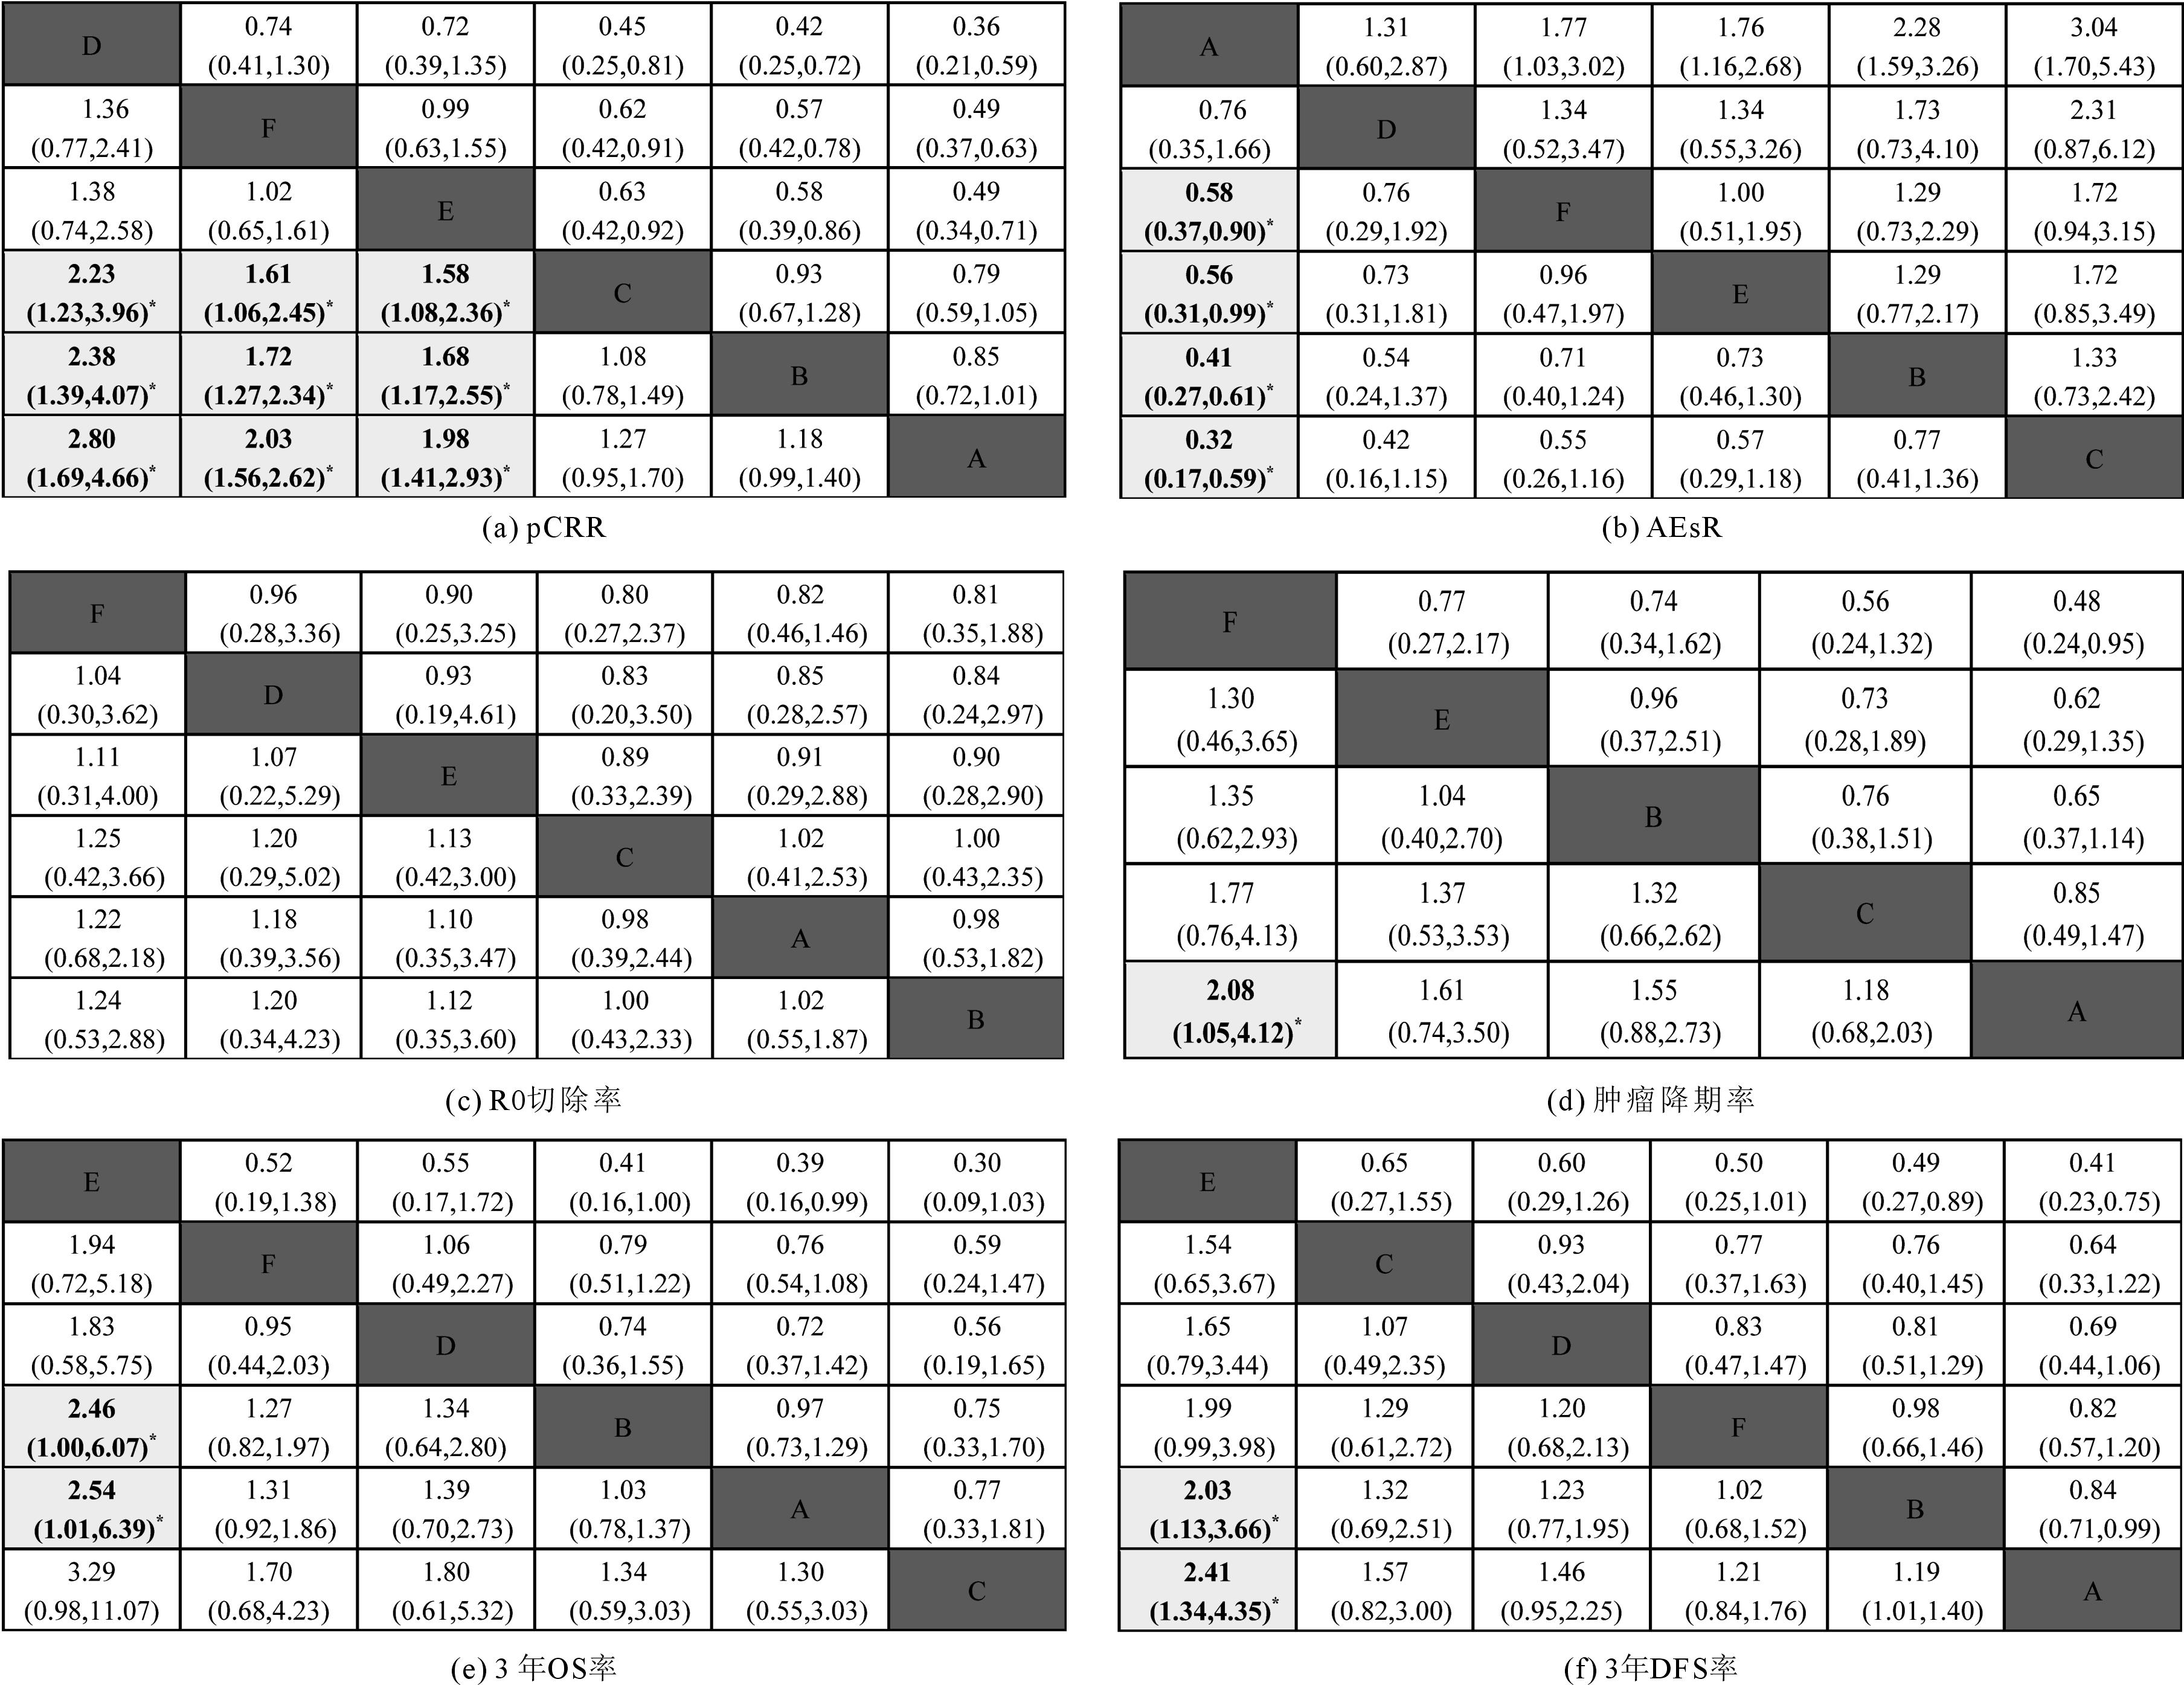

| 方案 | ≥3级不良反应发生数/总人数 | ||||||||||
|---|---|---|---|---|---|---|---|---|---|---|---|
| 胃肠道不良反应 | 血液系统不良反应 | 其他不良反应 | |||||||||
| 腹泻 | 呕吐 | 恶心 | 直肠炎 | 中性粒细胞 减少 | 血小板 减少 | 神经病变 | 手足综合征 | 放射性皮炎 | |||
| E | 98/751 | 9/460 | 16/460 | 9/510 | 27/271 | 14/460 | 20/460 | 11/475 | 2/460 | ||
| F | 28/378 | 4/320 | 8/262 | 16/265 | 22/445 | 10/325 | 2/202 | 3/202 | 21/325 | ||
| OR (95%CI) | 1.76 (1.18,2.63)a | 1.57 (0.49,5.04) | 1.14 (0.49,2.63) | 0.29 (0.13,0.65)* | 2.02 (1.17,3.47)a | 0.99 (0.45,2.20) | 4.39 (1.04,18.61)* | 1.56 (0.44,5.53) | 0.07 (0.02,0.29)* | ||