×
模态框(Modal)标题
在这里添加一些文本
Close
Close
Submit
Cancel
Confirm
×
模态框(Modal)标题
×
Toggle navigation
Home
About Journal
Editorial Board
Instruction
Journal Online
Just Accepted
Current Issue
Archive
Top Read Articles
Most Downloaded Articles
E-mail Alert
Subscription
Advertisement
Contact Us
中文
Figure/Table detail
Efficacy and safety of chemoradiotherapy sequencing on rectal cancer in total neoadjuvant therapy: a systematic review and network Meta-analysis
WANG Zichen, XU Shuna, WANG Jinmeng, REN Yanling, LI Weihua, DI Huifeng
Chinese Journal of Hospital Pharmacy
, 2024, 44(
1
): 79-87. DOI:
10.13286/j.1001-5213.2024.01.12
作者姓名及
年份
队列选择
可比性
结果
暴露队列的代表性
非暴露队列的代表性
暴露的确定
研究对象是否已经发生疾病
暴露与非暴露队列的可比性
结果测
定方法
随访时间是否足够长
随访完整性
分数
Calvo等2014
[
13
]
★
★
★
★
★
★
6
Cercek等2018
[
14
]
★
★
★
★
★★
★
7
Zhai等2020
[
18
]
★
★
★
★
★
★
6
Tab 4
Newcastle-Ottawa scale
Other figure/table from this article
Tab 1
Search strategy of PubMed database
Tab 2
Protocols of neoadjuvant therapy
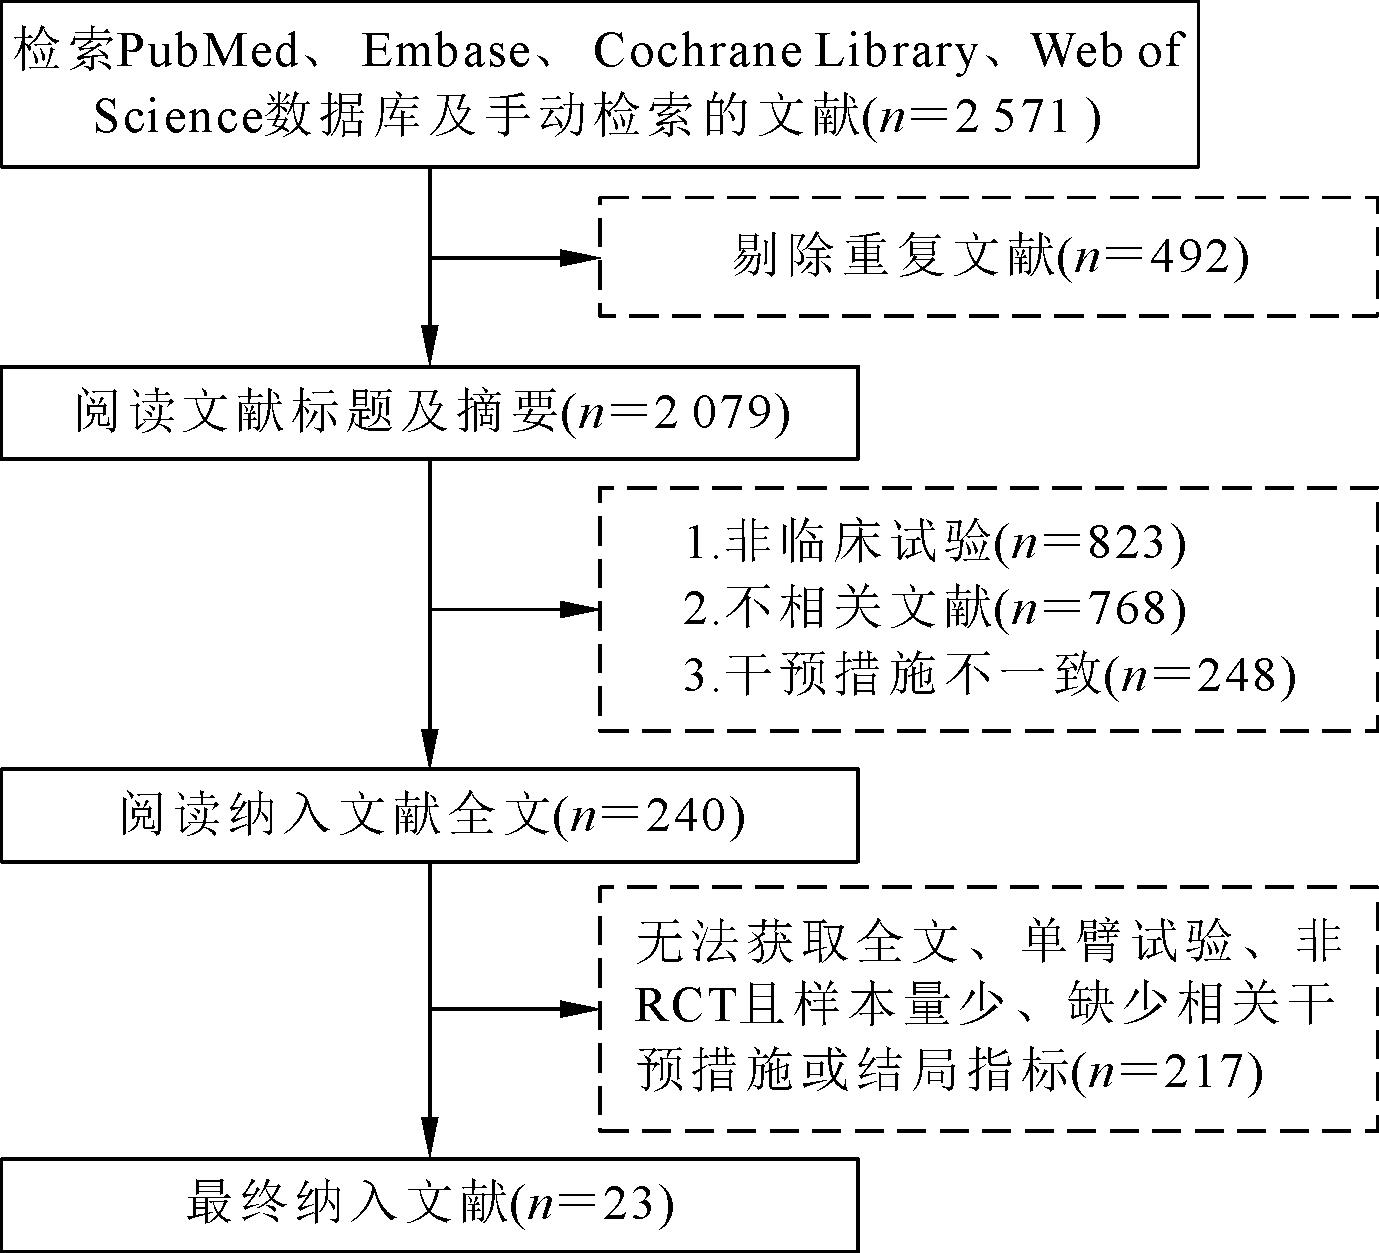
Fig 1
Flow chart of literature screening
Tab 3
Basic characteristics of the included studies
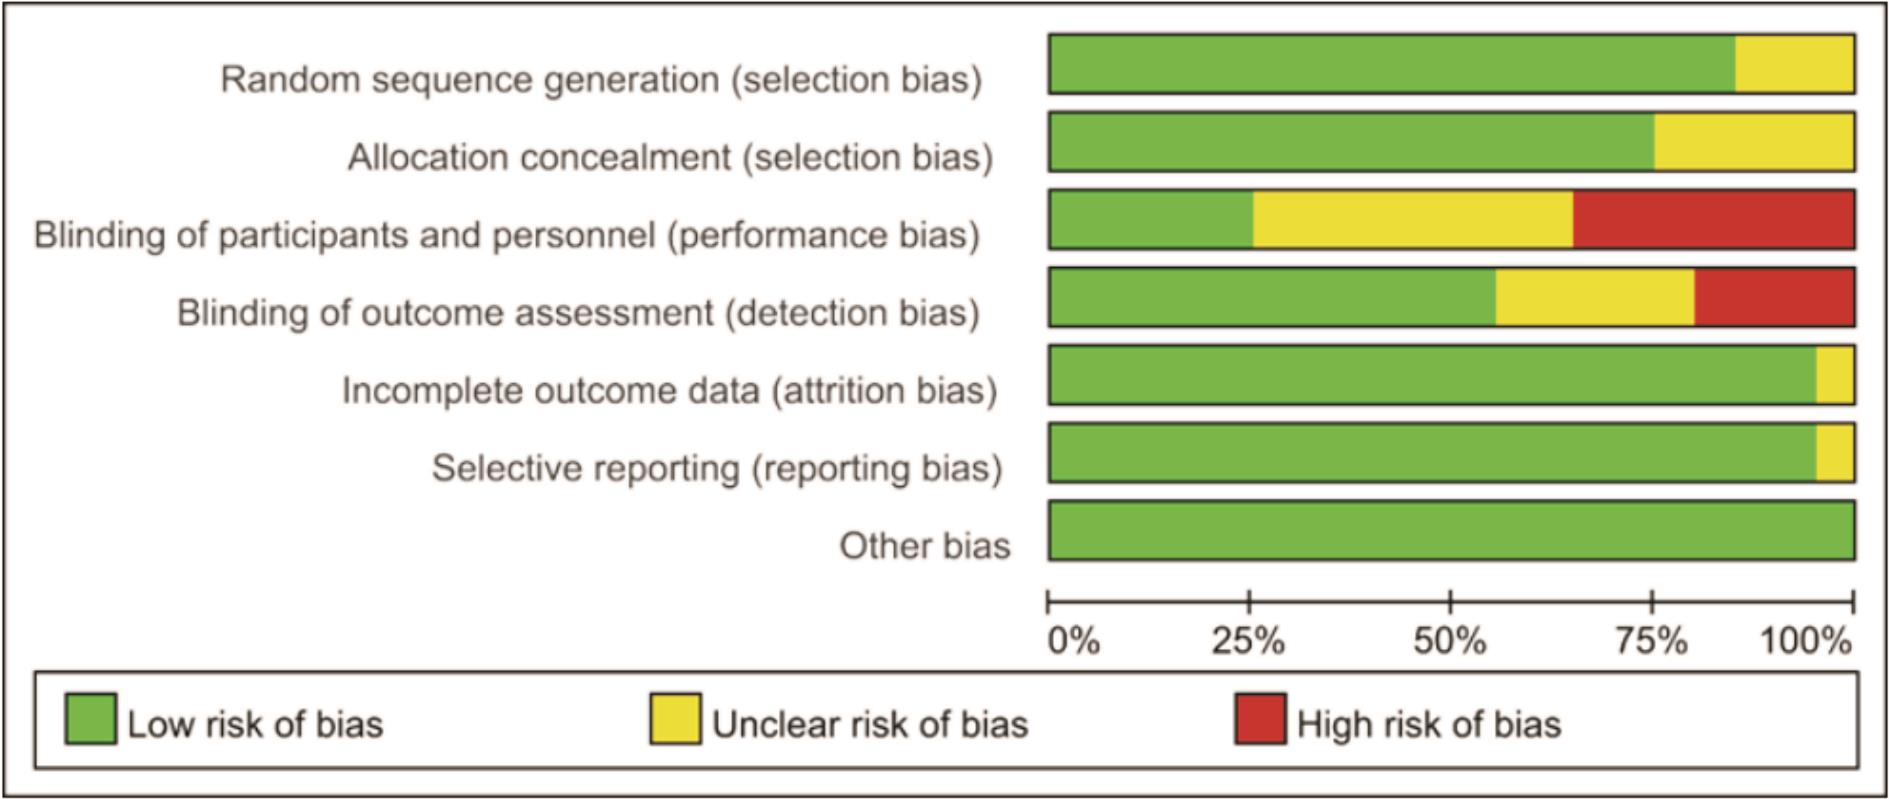
Fig 2
Evaluation results of risk of bias
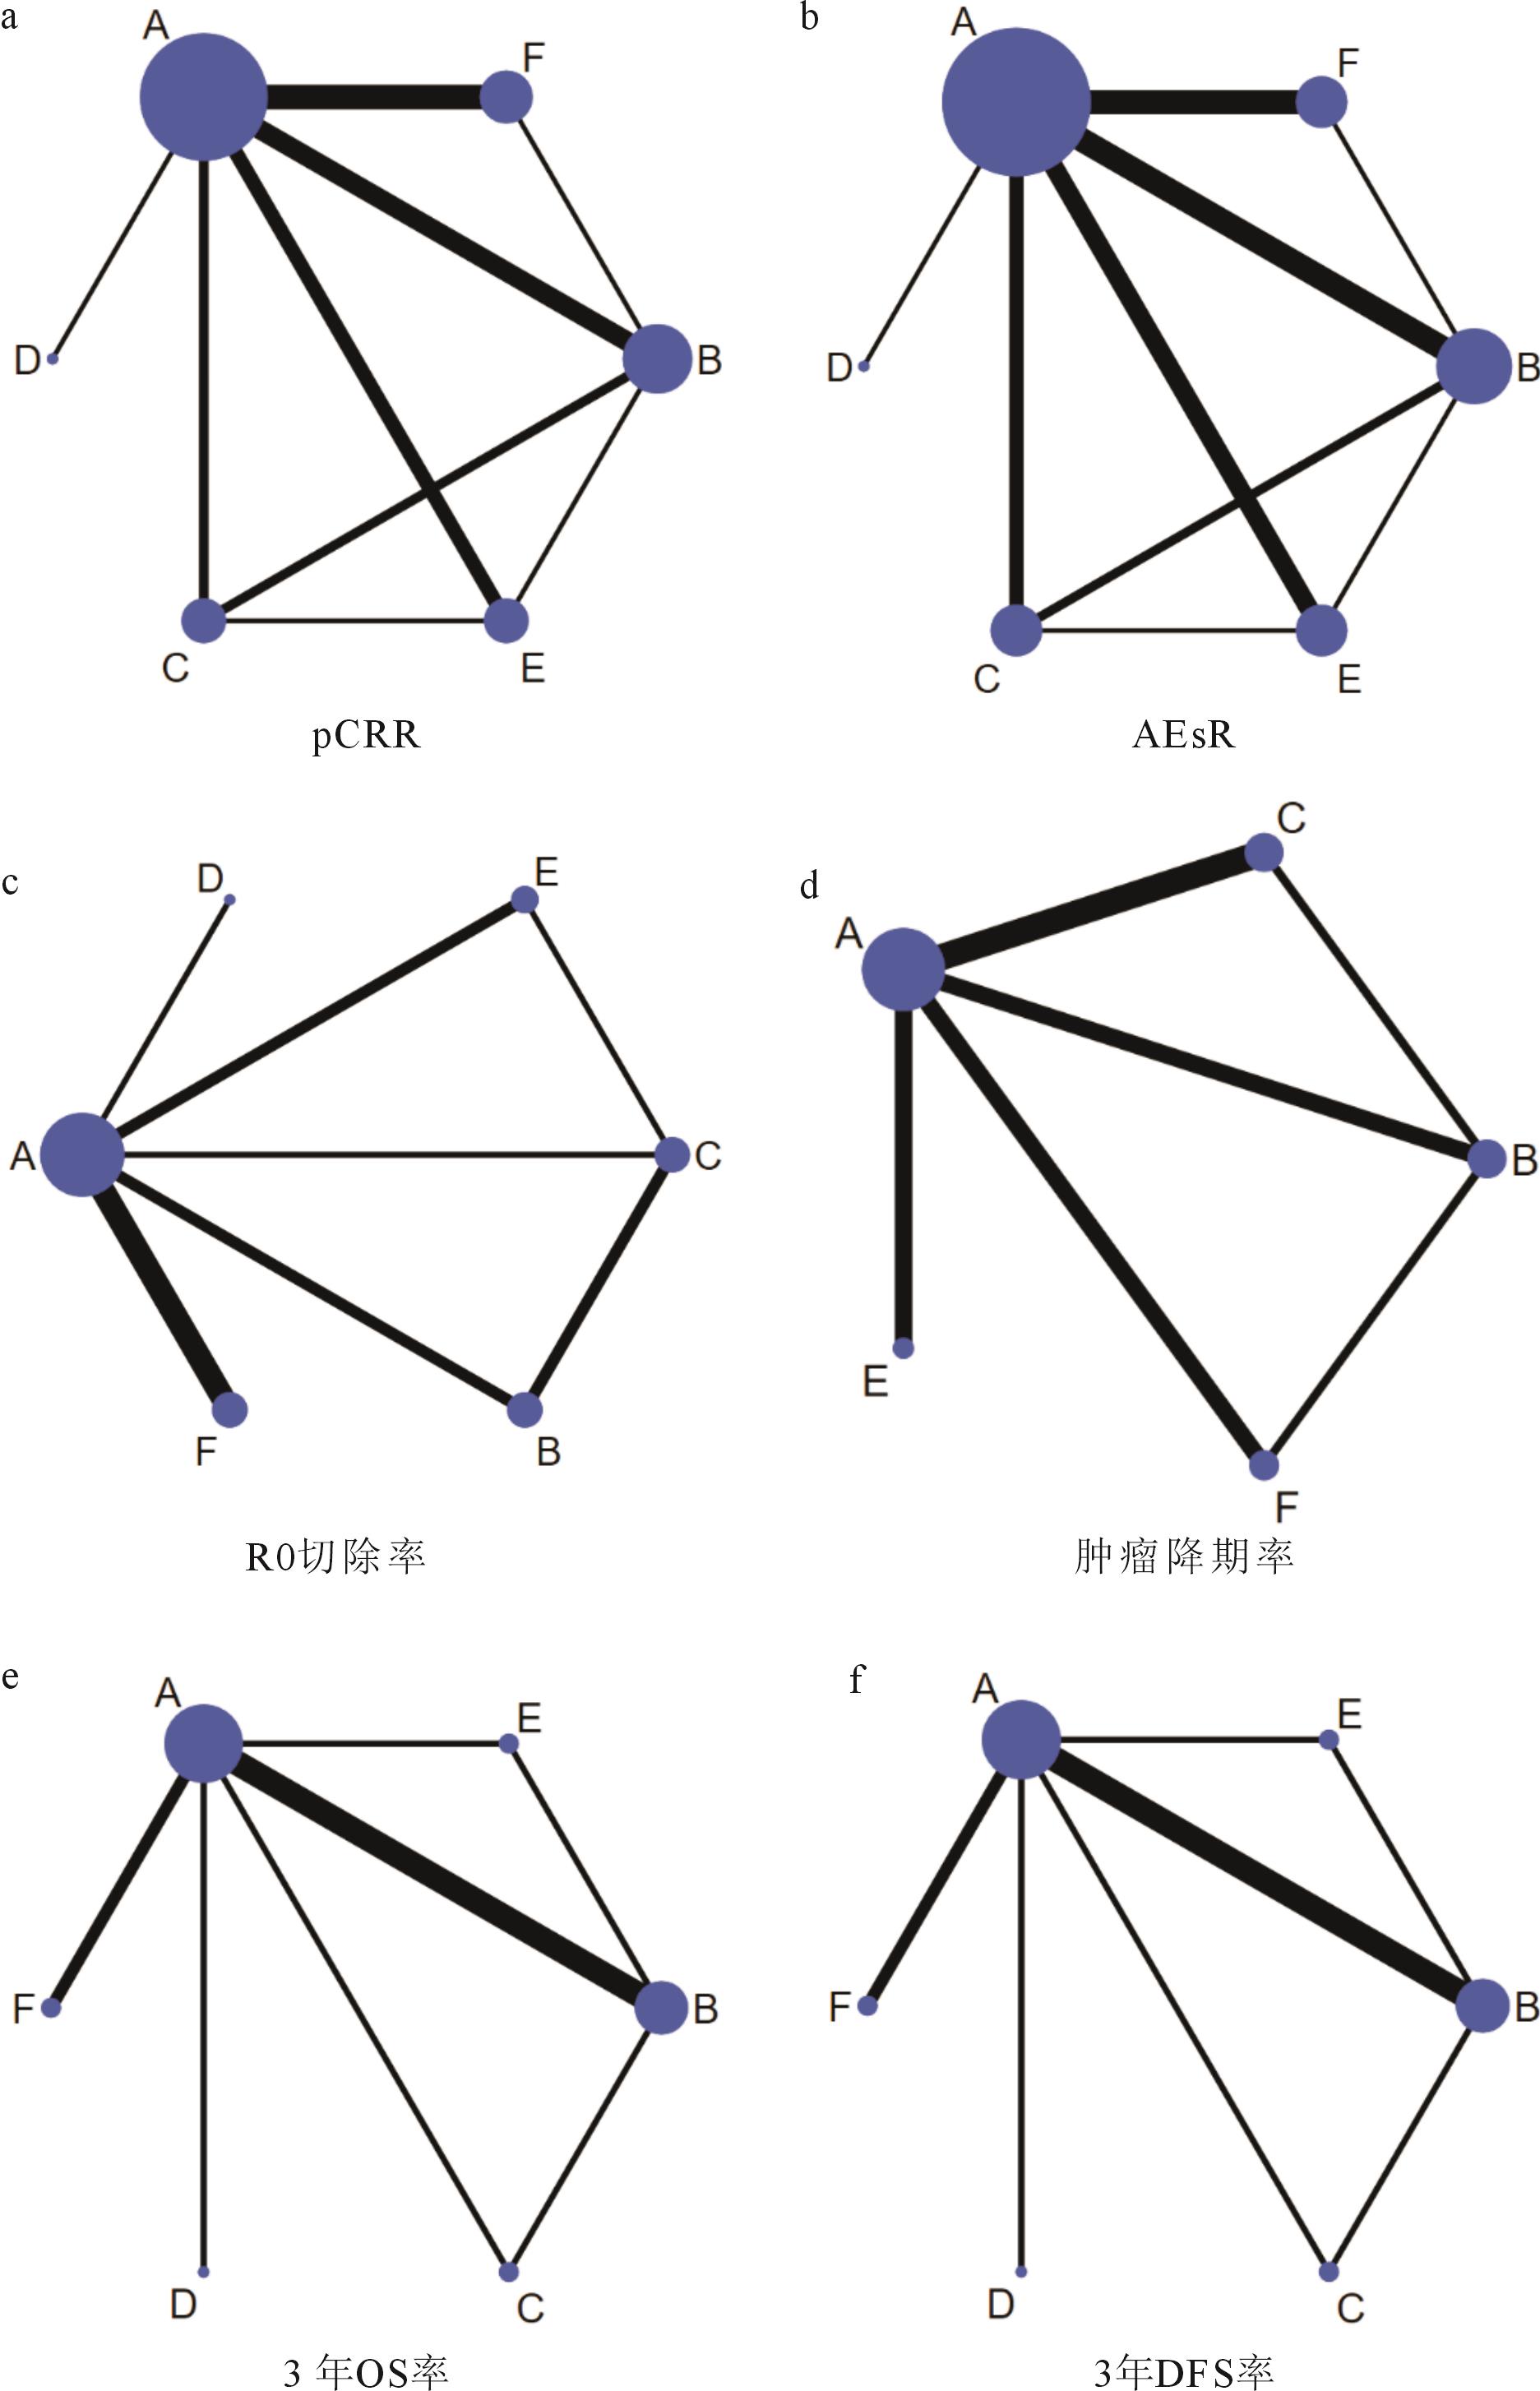
Fig 3
Network plots of each endpoint for each therapy model
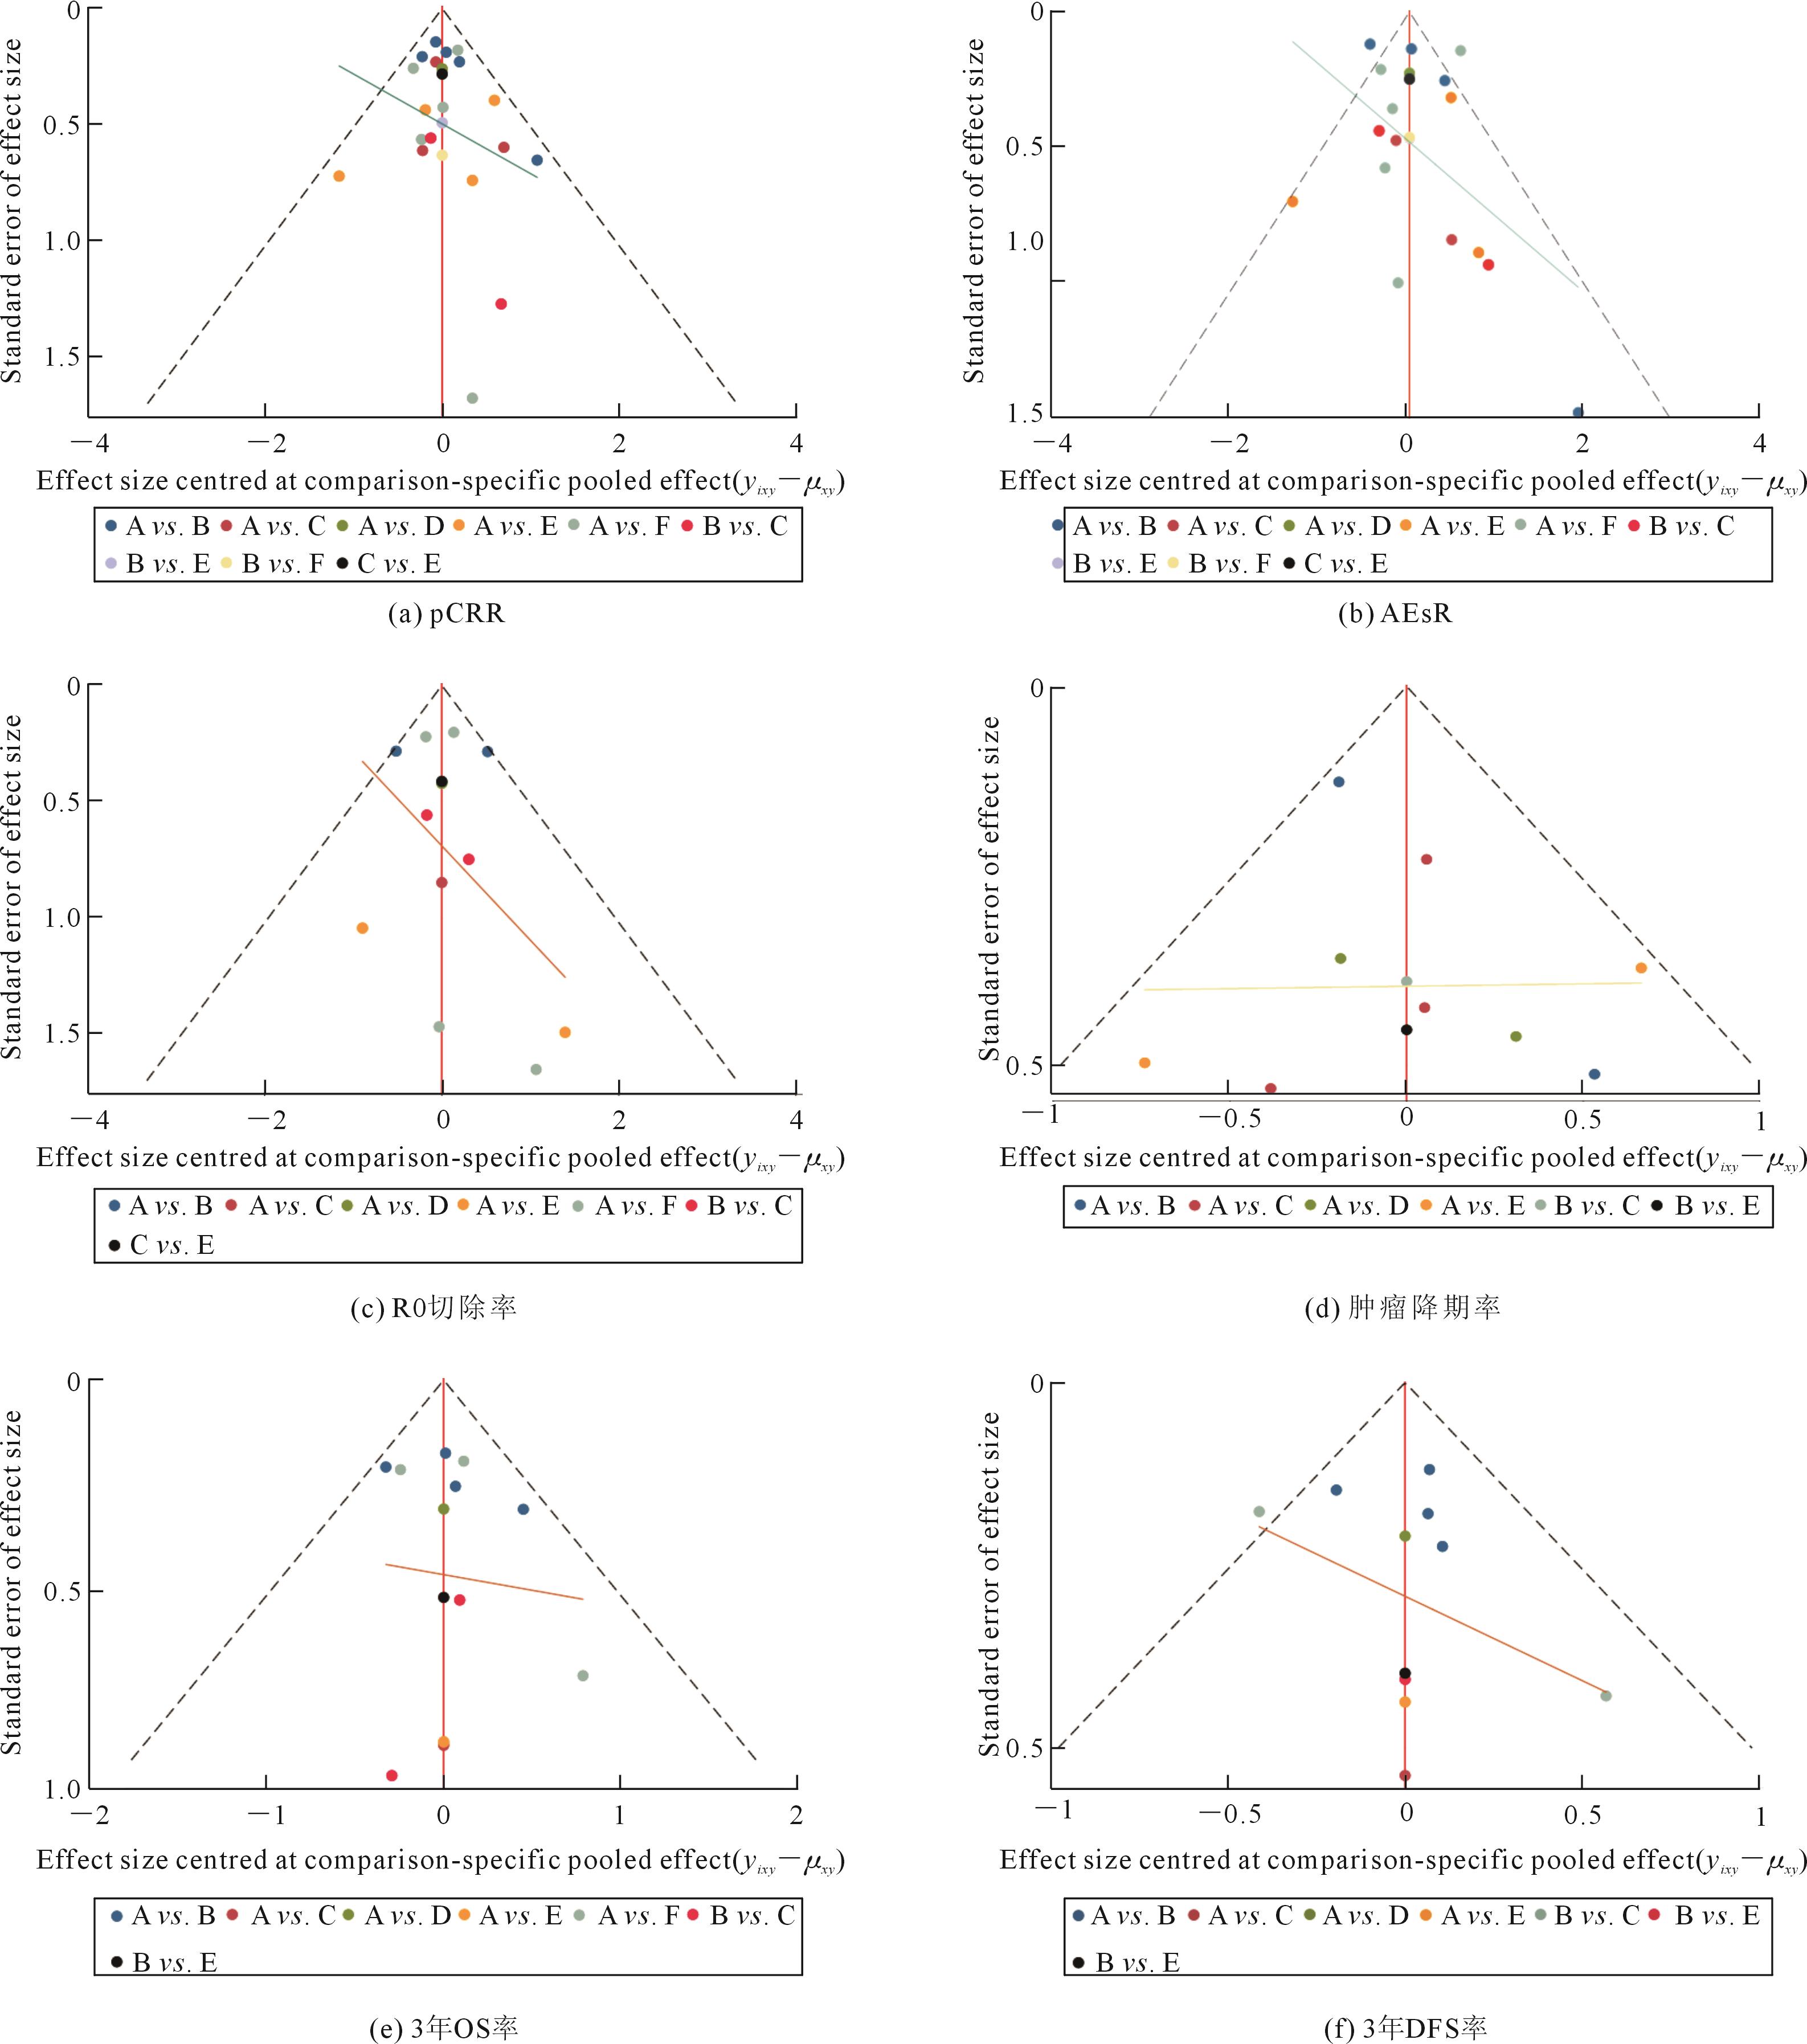
注(note):病理完全缓解(pathological complete response rate, pCRR); 不良事件发生率(adverse effects rate,AEsR);总生存期(overall survival, OS);无病生存期(disease free survival, DFS)。
Tab 5
SUCRA of each regimen with regard to all outcomes for each therapy model
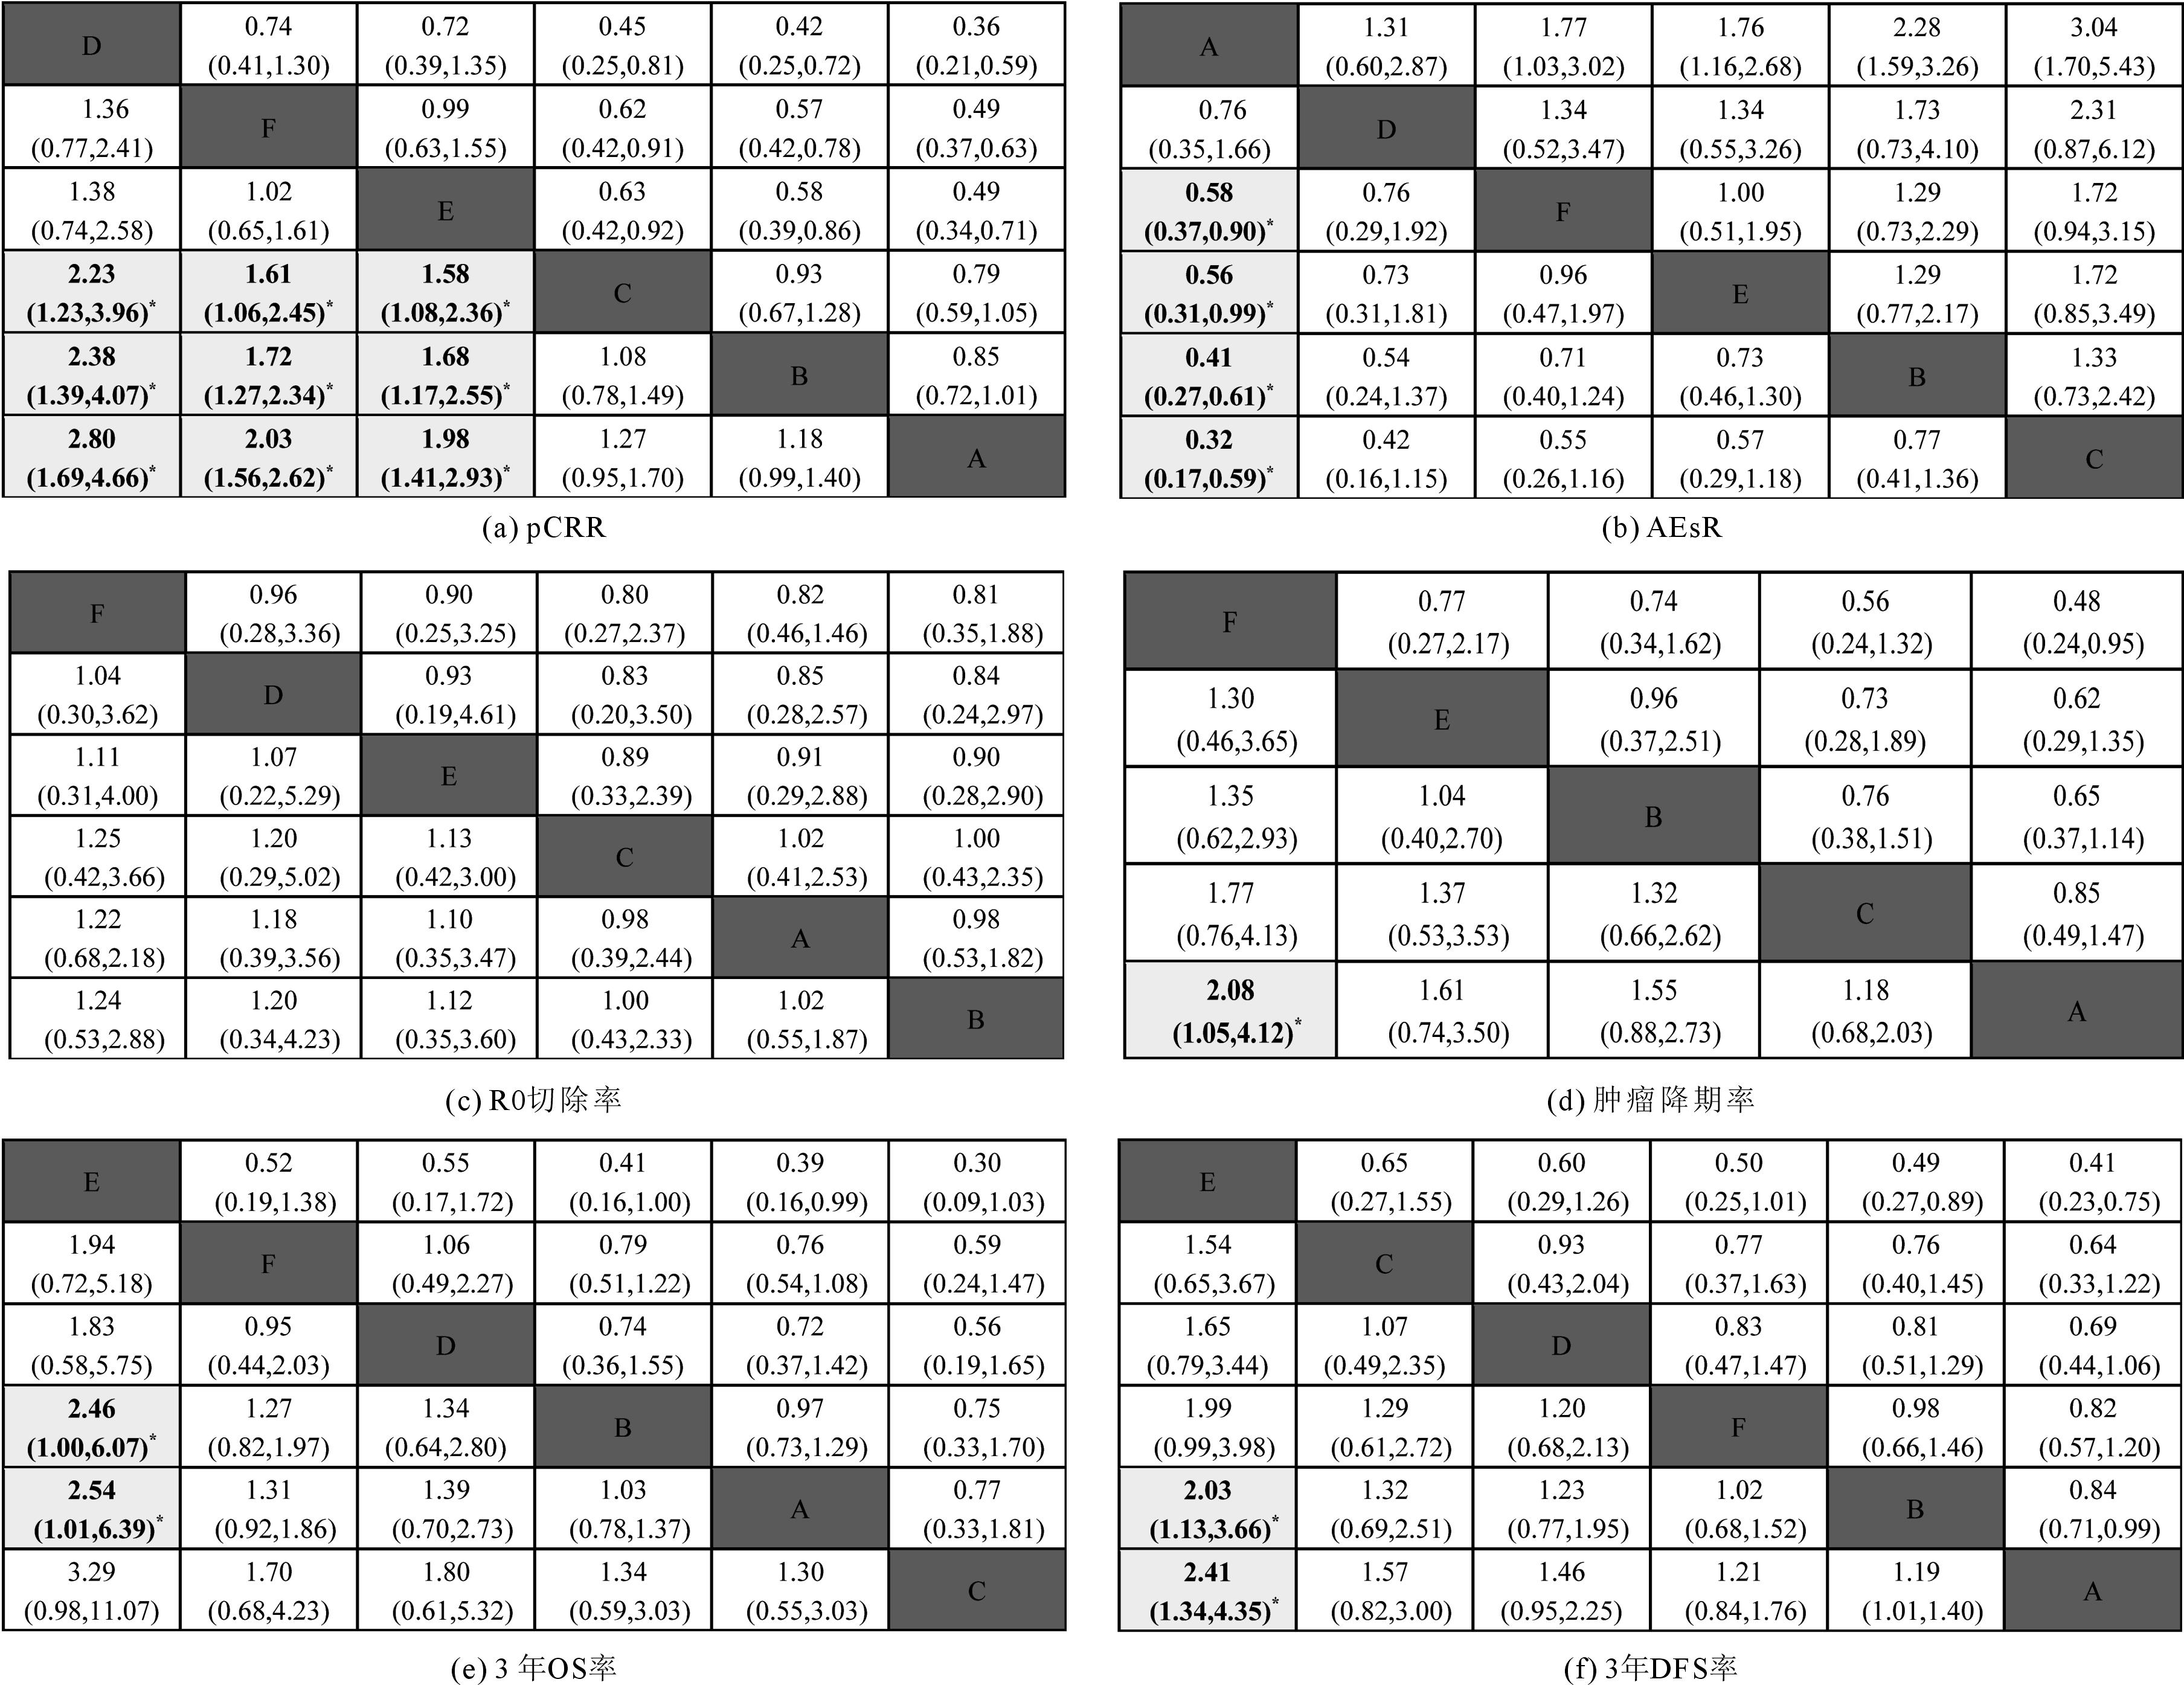
Fig 4
Odds ratio (OR) and 95%CI of all regimens from network Meta-analysis for six indicators
注(note):中间深色板块将联赛表分为上下两部分,OR(odds ratio) 值代表列与行两方案的比值比[different interventions in the middle blocle divded the graph into upper and lower triangle;the OR (odds ratio) value represents the odds ratio of the two prototocols in the column and row];95%CI 不包括1.00代表两方案有显著性差异,用灰色方块表示,且加粗标有星号(95%CI excluding 1.00 means there is a significant difference between the two protocols and is represented by a gray square with a bold asterisk)。
Tab 6
Comparison of adverse events between regimens E and F
Fig 5
Bias funnel plots for six outcome indicators